In this post, we are going to compare Apache JMeter and LoadView using a practical scenario for the website PhoneNumberMonitoring.com. The idea is simple—simulate a real user journey: launch the site, log in, navigate to a tab, and log out.
But how we achieve that in JMeter vs LoadView is completely different—especially when it comes to effort, flexibility, and real-world simulation.
Using JMeter: Manual Scripting & Technical Complexity
Let’s start with JMeter.
As you can see in the first screenshot, the user needs to configure the HTTP(S) Test Script Recorder, set up port 8888, and use a browser proxy to capture traffic. This part alone takes time, especially if the user is new to proxy setups.
JMeter HTTP(S) Test Script Recorder Setup
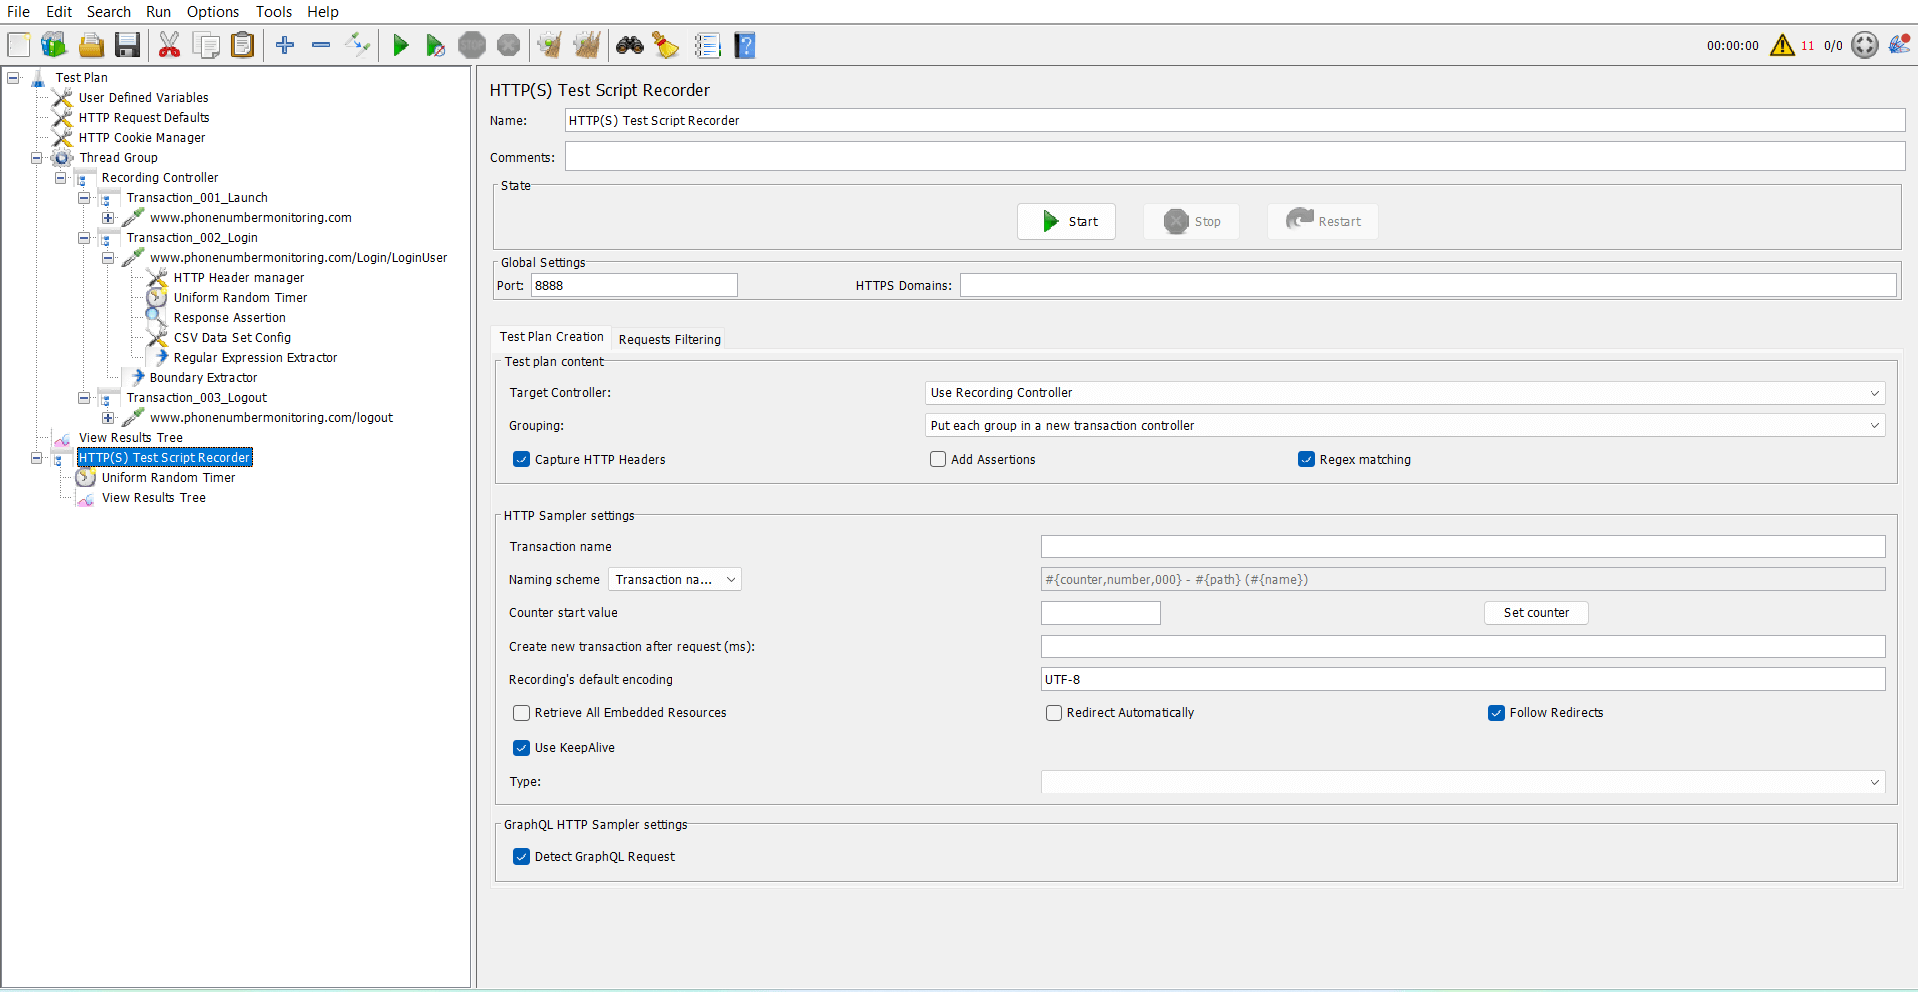
Things we had to do in JMeter:
- Set up Thread Group, Recording Controller, and HTTP Cookie Manager
- Configure the port, install JMeter certificates for HTTPS
- Use Regular Expression Extractors and Boundary Extractors to capture dynamic values (like session IDs, tokens)
- Write custom naming conventions for transactions
(see login-16 to login-25 in the second screenshot) - Manually create transactions like:
- Transaction_001_Launch
- Transaction_003_Login
- Transaction_003_Logout
JMeter Recorded Flow with Multiple Samplers
And let’s not forget the dynamic values — JMeter requires manual correlation. That’s a whole task in itself. It demands a good understanding of the request/response structure and how to extract/replace values dynamically.
Want to simulate real-world behavior like think time, navigation delays, or complex flows? Users either need to write scripts or rely on third-party plugins.
Distributed Load Testing? That’s another rabbit hole. You’ll need:
- Multiple JMeter servers
- Master-slave setup
- Firewall rules
- Manual orchestration
It’s possible, but not quick or easy.
Using LoadView: Browser-Based, No-Scripting Simplicity
With LoadView, things are drastically simplified.
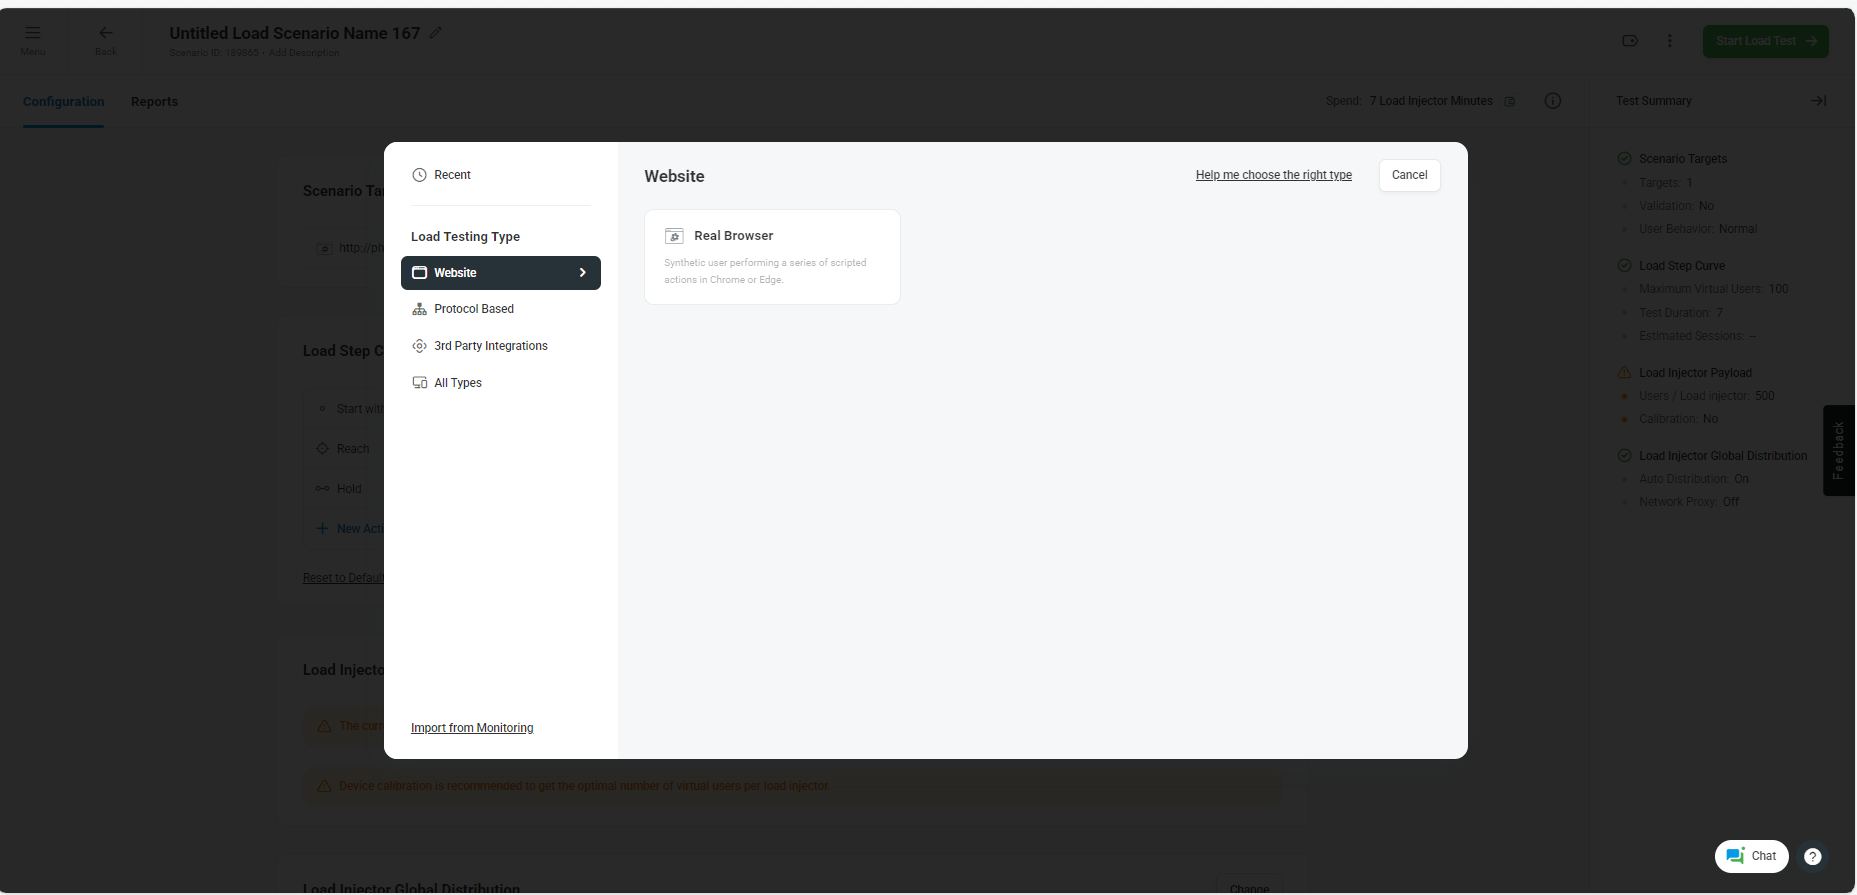
It’s fully browser-based testing using Chrome or Edge — no need to worry about HTTP-level configurations or plugins.
Screenshot 3: LoadView – Select Website > Real Browser
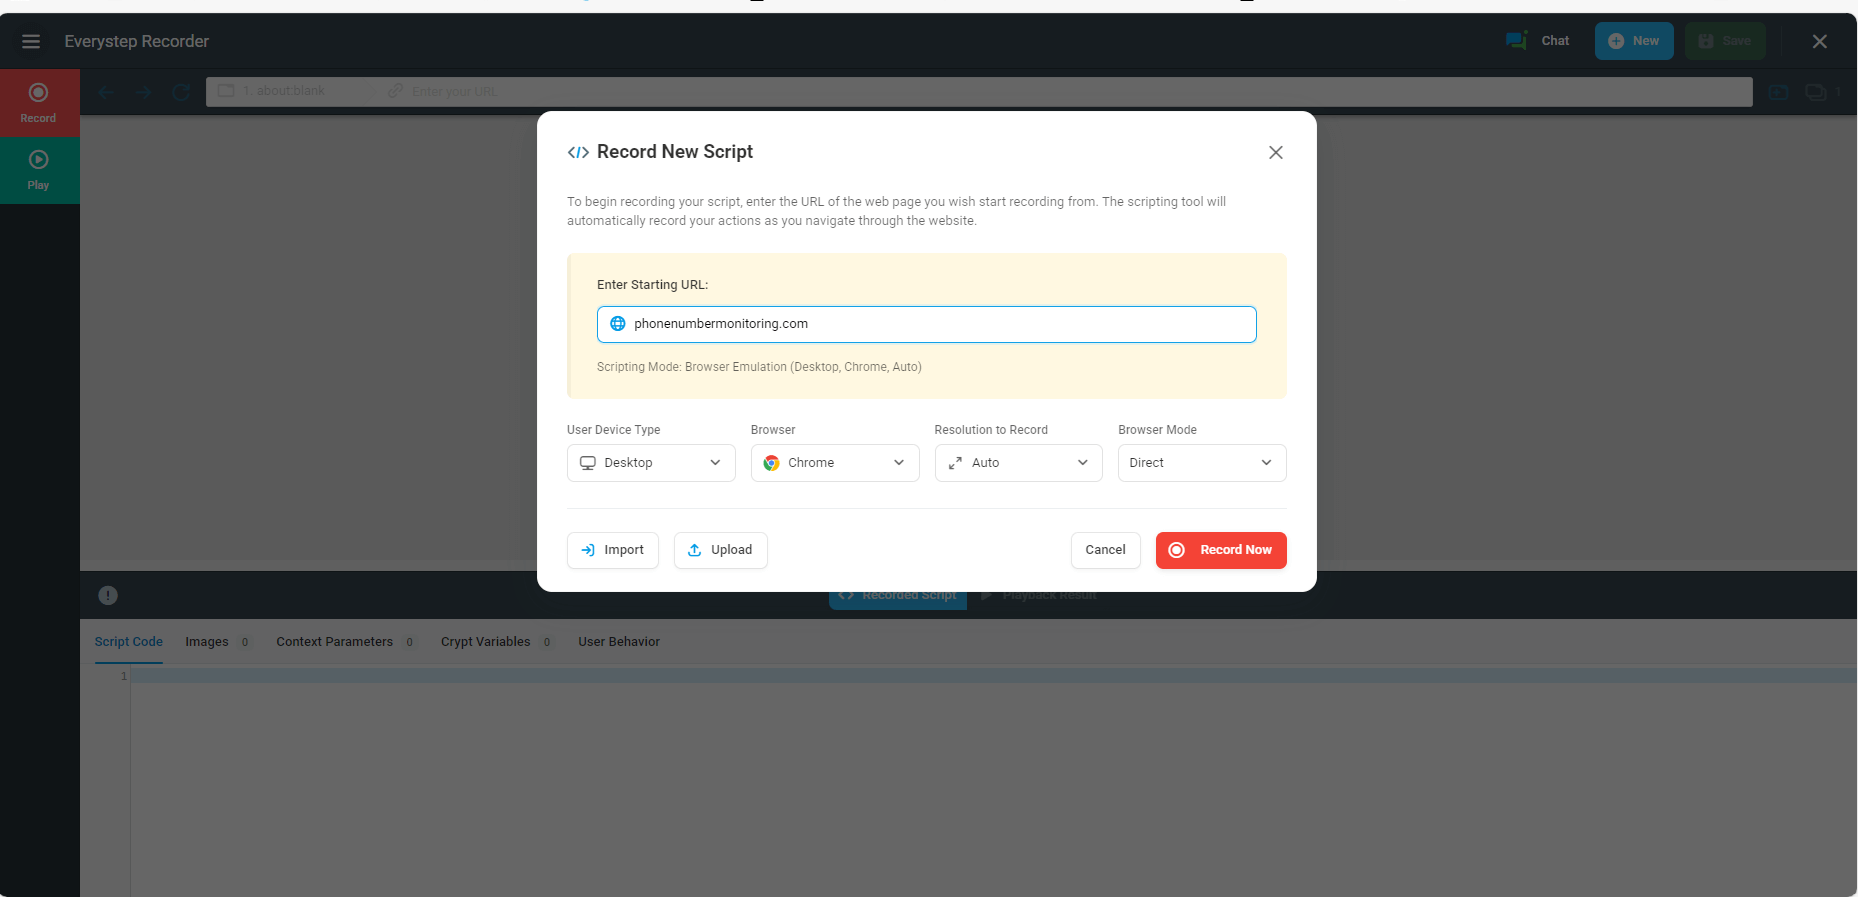
Then we launched the EveryStep Recorder, entered the URL, and walked through the steps:
login → navigate → logout
EveryStep Recorder Configuration
That’s it. LoadView automatically handles all dynamic values—no need for correlation or extractors.
What took 30–60 minutes in JMeter can be done in under 5 minutes in LoadView.
Why LoadView Is Effortless
- Real browser simulation (Chrome/Edge)
- No plugin or proxy setup
- No scripting needed — just know the use case
- Auto correlation of all dynamic values (session ID, CSRF tokens, etc.)
Real-World Scenario Simulation Made Easy With LoadView
This is a huge differentiator. In JMeter, setting up realistic load profiles or geo-based traffic simulation involves plugins, servers, and scripting.
But in LoadView:
Choose Execution Mode (Cloud, On-Prem, Proxy Agent)
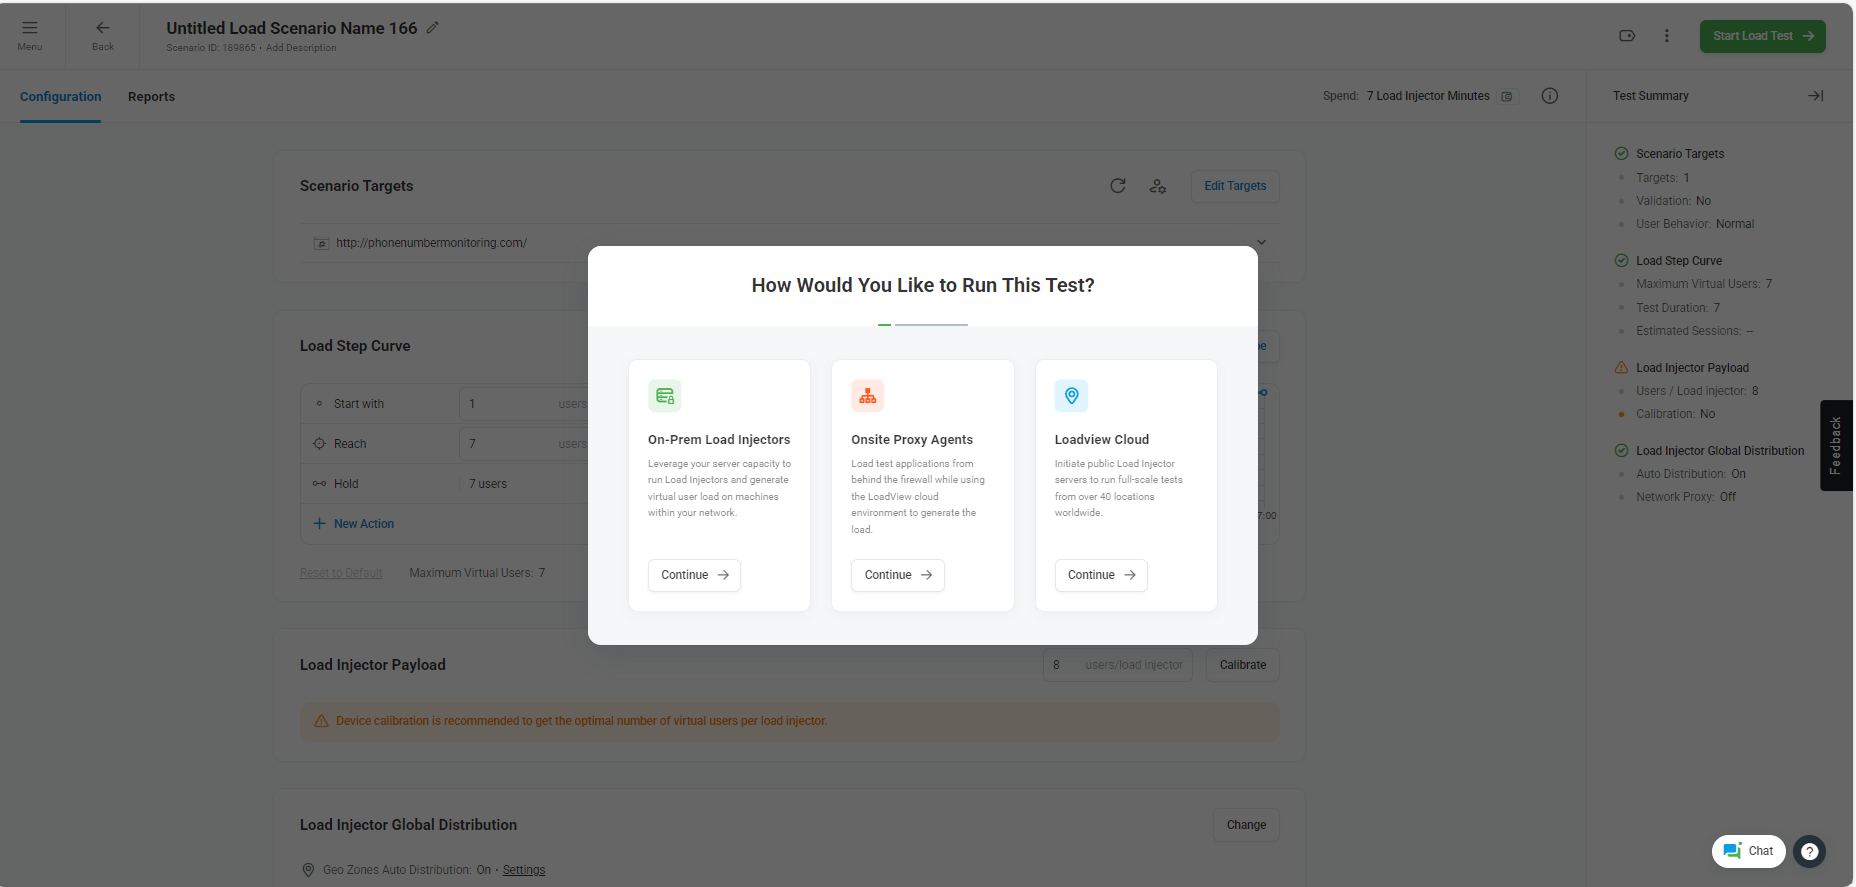
Configure Load Step Curve
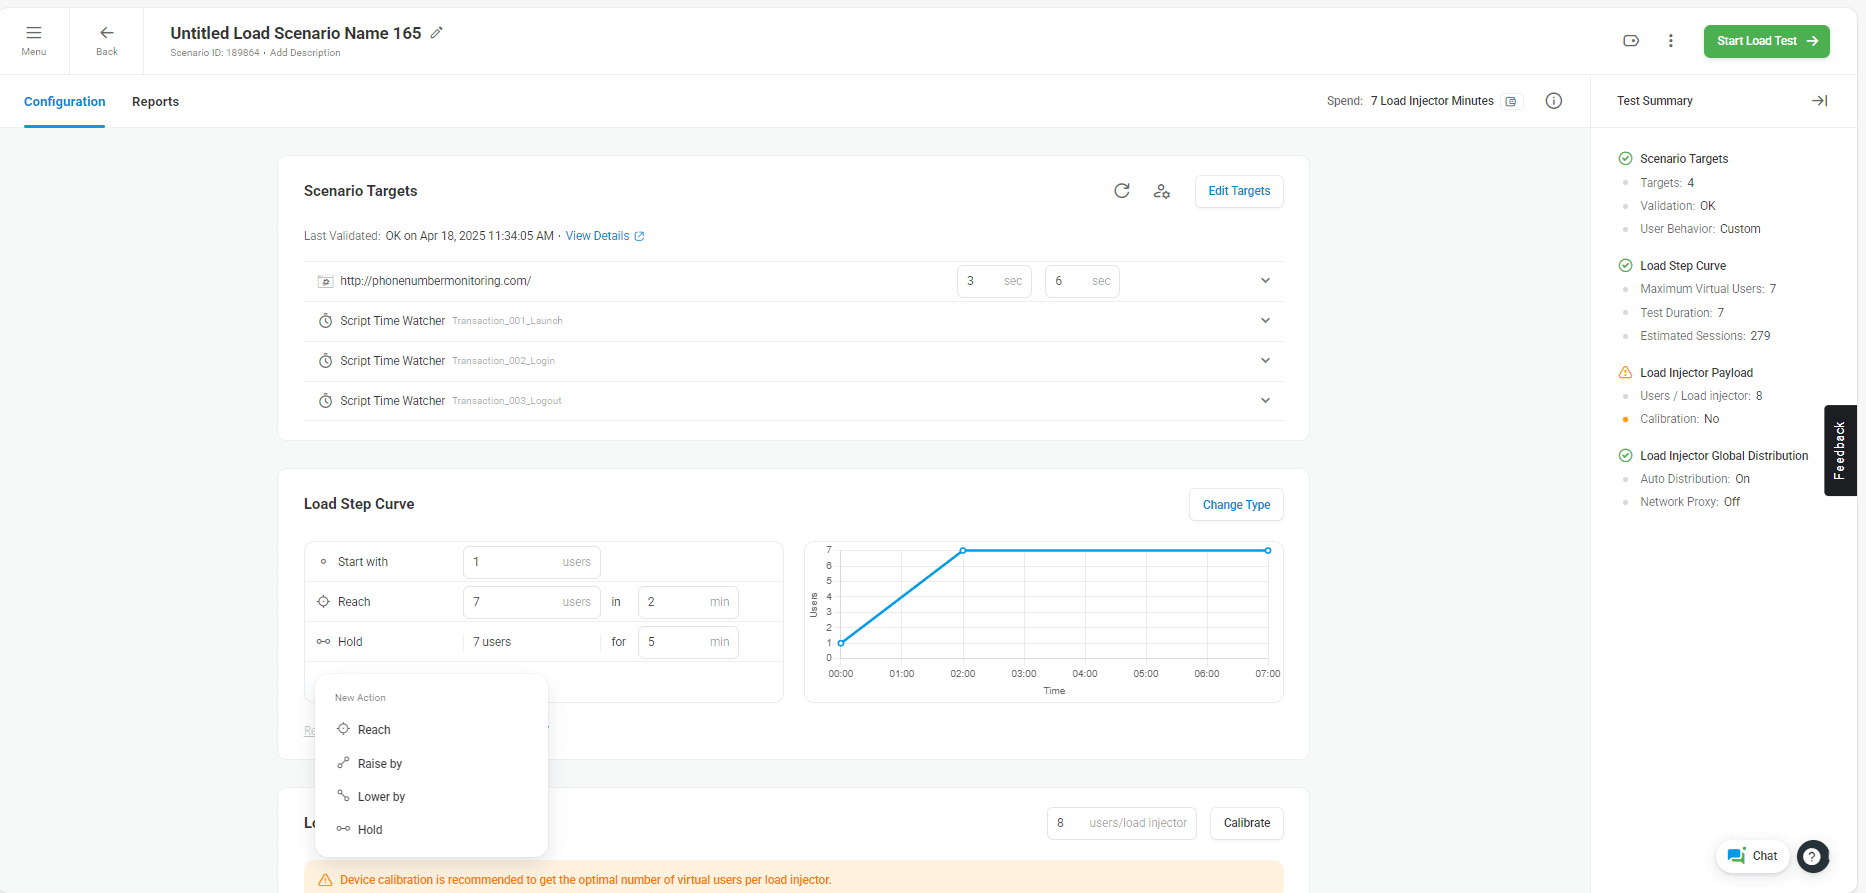
You can visually define the load pattern:
- Start with 1 user
- Reach 7 users in 2 mins
- Hold 7 users for 5 mins
Select Geo Load Injector Locations (40+ options)
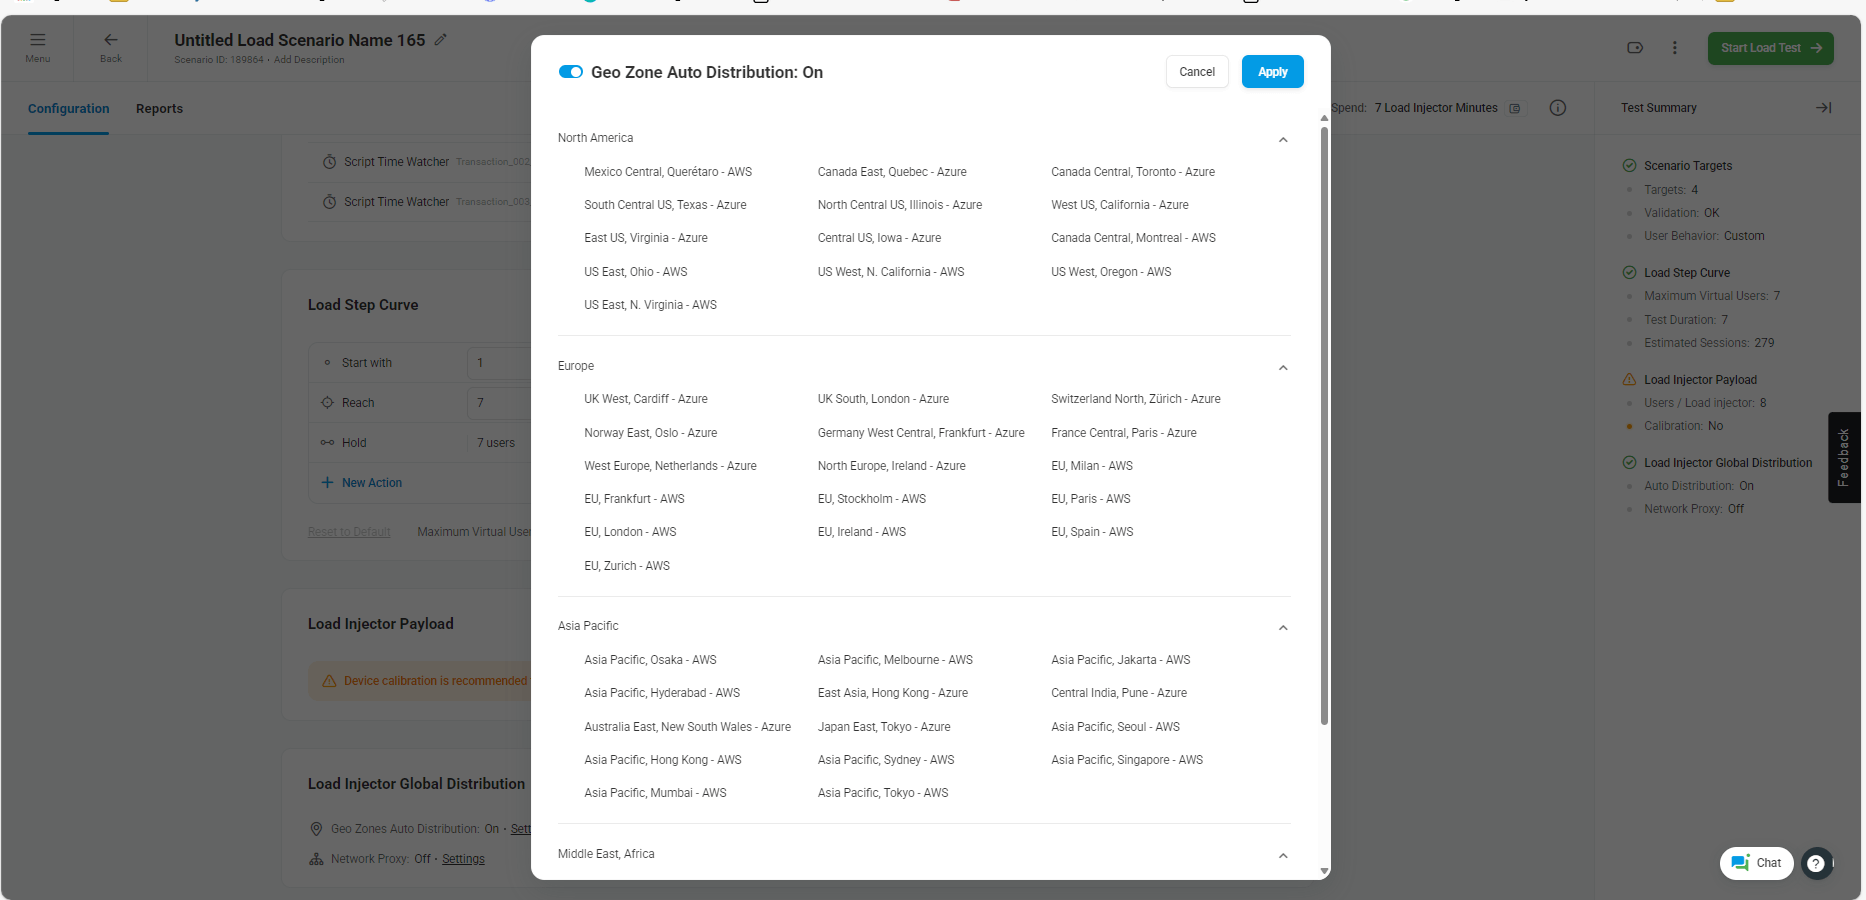
This kind of cloud-based flexibility under one umbrella — with zero scripting — is what makes LoadView incredibly user-friendly.
Summary: JMeter vs LoadView
| Feature | JMeter | LoadView |
| Scripting Required | ✅ High | ❌ None |
| Dynamic Value Handling | ❌ Manual correlation | ✅ Automatic |
| Real Browser Simulation | ❌ Not natively supported | ✅ Built-in |
| Distributed Load Testing | ❌ Complex setup | ✅ One-click, 40+ locations |
| Ease of Use | 👨💻 For technical users | 🧑💼 For anyone who knows the flow |
| Time to Create Test | ⏱️ 30–60 mins | ⚡ 5–10 mins |