Why Companies Invest in Load Testing
Investing in Load Testing: Worth It or Not?
In today’s fast-paced digital world, where user satisfaction reigns supreme, companies are investing increasingly in load testing to ensure their software applications run smoothly and seamlessly. Load testing is like giving your application a stress test before it goes live, allowing you to find and fix any issues that might slow it down or cause it to crash. It’s all about ensuring users have a great experience when interacting with your software. Your customers expect reliable websites, and if your online services struggle, your buyers will move to competitors. Recent research has shown that clients are extremely impatient when it comes to slow-loading services. Downtime is less critical than performance slowdowns. Up to 200 percent more people never return when they experience unsatisfied response times.
Successful companies also know that load testing is a crucial step in their development journey. They make sure to check the performance of their systems during the implementation and testing phases. It’s amazing how even small decisions, like picking the right framework or database, can make or break the scalability and stability of a new application. Plus, trying to guess the size of infrastructure without proper load simulation is like shooting in the dark—it can lead to wasting money on oversized hardware. And here’s something interesting: search engines now consider response time when ranking websites. So, if you’ve invested in SEO but your site loads slowly, you might not get the ranking you deserve. It’s all about making sure your website is fast and reliable to keep your customers happy and stay ahead of the competition!
Another reason for load testing is that organizations can validate the speed of new applications and compare them with given performance thresholds. By ironing out these kinks early on, you’re saving yourself from potential headaches down the road. Think of load testing as your application’s personal trainer, helping it get into top shape so it can perform at its best when it counts. So, by investing in load testing, companies aren’t just ensuring their applications work well—they’re also investing in happier users and smoother operations overall. It’s a win-win!
Key Reasons to Invest in Load Testing
Let’s delve into the compelling reasons behind the decision to invest in load testing.
- Preventing Performance Bottlenecks: Load testing allows companies to simulate real-world usage scenarios, putting their software under various levels of stress to identify performance bottlenecks. By uncovering these bottlenecks before deployment, companies can proactively address them, ensuring that their applications can handle the expected user load without compromising on performance.
- Enhancing User Experience: In today’s hyper-competitive market, user experience is non-negotiable. Load testing enables companies to assess how their applications perform under heavy loads, ensuring that users enjoy a smooth and uninterrupted experience, regardless of the number of concurrent users. By prioritizing user experience through load testing, companies can foster customer satisfaction and loyalty, driving business growth.
- Mitigating Risks: The consequences of software failure can be dire, ranging from financial losses to reputational damage. Load testing helps companies identify potential points of failure in their applications, allowing them to implement robust contingency plans and minimize the risk of downtime. By proactively addressing performance issues through load testing, companies can safeguard their operations and protect their bottom line.
- Optimizing Resource Utilization: Inefficient resource allocation can lead to wasted resources and unnecessary expenses. Load testing provides insights into how applications utilize resources under different load conditions, enabling companies to optimize resource allocation and maximize cost-effectiveness. By fine-tuning resource utilization through load testing, companies can achieve better scalability and performance without overspending on infrastructure.
- Facilitating Scalability: As companies grow and user bases expand, scalability becomes a critical consideration. Load testing enables companies to assess how their applications scale under increasing loads, identifying scalability bottlenecks, and optimizing infrastructure to accommodate growing user demand. By proactively addressing scalability through load testing, companies can future-proof their applications and support business growth seamlessly.
Load testing doesn’t have to be difficult, and it’s something that companies should invest in. Alongside load testing, it’s important for companies to invest in a reliable load testing tool to streamline the process for their teams. Tools such as LoadView offer a plethora of valuable features, ensuring smooth integration with existing processes and delivering comprehensive test results. These results empower teams to make actionable improvements to their applications, enhancing performance and user experience effectively.
How Does LoadView Work?
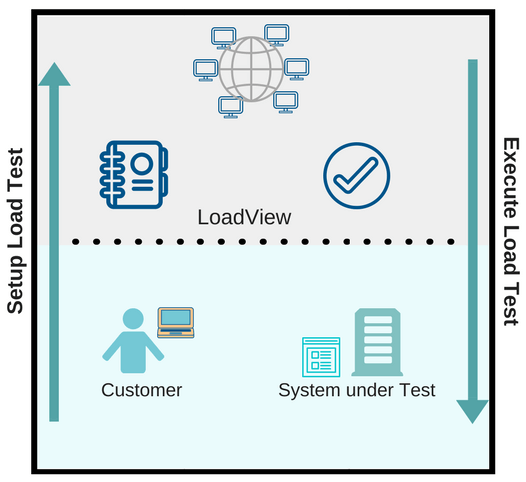
Load testing is often time consuming and is prone to errors. With the LoadView solution, we handle complex tasks like setting up load generator farms and creating globally distributed agents, eliminating costly setup and maintenance challenges for you. This frees up more time for crucial activities like test design, execution, and analysis.
LoadView is cloud-based, enabling quick execution of load tests within minutes. Unlike traditional on-premises and open-source tools, which often delay performance testing due to setup and integration complexities, LoadView eliminates this hurdle by offering fully managed load injectors worldwide.
While many load testing solutions offer protocol-based user simulation, which may not provide comprehensive results, LoadView offers a versatile approach. Whether you prefer protocol, headless browser, or real browser-based testing, LoadView provides everything you need for thorough user simulation. This ensures that your testing covers all aspects, avoiding the oversight of critical end-to-end response times.
LoadView Use Cases
LoadView is invaluable in various critical scenarios, aiding in the identification of performance slowdown causes.
- Scalability Issues: When a new application slows down, and you have no idea why. LoadView can help you determine the load limit of your application.
- Infrastructure Sizing: What type of hardware do we need for a new website? You can guess but realize that the chance for an expensive failure is high. Oversized infrastructure is a waste of money, and a small server could result in massive performance problems.
- Validating Performance Requirements: Your team documented detailed performance requirements. Under single user conditions the load times are acceptable but how will the new website behave under real production like load situations?
- Concurrency Challenges: The functional test team reported that some features of the new site don’t respond to user input. This problem occurs randomly and often just when many testers are using those functions.
- 3rd Party Services Evaluation: Your developers build a content-rich new website full of third-party scripts. Nobody has a clue how those external services behind third-party content will behave under normal or peak load conditions.
Steps to Setup a Load Test
LoadView offers a fully web-based platform that’s incredibly intuitive. Say goodbye to the hassle of spending days on complex installations. Simply sign up for the free trial or open your account and begin load testing right away. We’ve simplified the entire process, from setup to execution and analysis. Whether you’re a seasoned performance engineer or new to load testing, it’ll only take you a few minutes from creating your script to launching your test. LoadView seamlessly guides you through the entire load testing process in just five easy steps outlined below.
Step 1: Create Your Load Simulation Script or Device
It’s essential to optimize your load testing scripts for efficiency. Often, just 20 percent of use cases contribute to 80 percent of the total transaction load. Once you’ve identified these critical user interactions, selecting the right simulation approach is key. LoadView offers flexibility with protocol, headless browser, and real browser-based simulations, allowing you to tailor your tests to match your application’s technology and testing objectives.
For stress tests that focus on backend performance, protocol-level scripts are ideal. These simulate high loads efficiently, especially for web services, as they have low overhead and can run multiple scripts in parallel on a single load injector, reducing costs.
To validate end-to-end response times, real browser-based tests are recommended. LoadView simplifies this process with the EveryStep Web Recorder, which captures and replays user interactions. This intuitive tool allows you to navigate through test cases, record actions, add timers for custom actions, and include verification steps. The EveryStep Web Recorder not only enhances load testing but also supports automated execution of repetitive tasks in your environment, adding further value to your testing and monitoring efforts.
Step 2: Validation
Excessive load on injection machines can adversely affect end-to-end response times. That’s why LoadView incorporates a validation step that conducts a single-user test using your script and determines the maximum number of users per injection machine. This calibration process safeguards against inconsistent test outcomes caused by bottlenecks on individual load agent machines.
Step 3: Execution Plan
Marketing campaigns, sales, and other measures can have a huge impact on the number of hits arriving at your websites. Typically, the user requests land slowly in the morning and reaches several highs over a full business day. It’s crucial to the success of your load test that you model a realistic execution plan. LoadView has various features that allow you to model a real-world load curve. You can specify how fast the user should be ramped up, how long a particular number of users should simulate the load, and at what rate they should be ramped down. The execution plan feature of LoadView gives you full flexibility to model a realistic load test scenario.
Step 4: Zone Configuration & Virtual User Distribution
We’re all aware of how network latency impacts webpage loading times. Let’s take, for instance, a webpage that refreshes and downloads 2MB of content, with each backend request taking 10ms. In your local data center, with its proximity and low latency, the load time would be under five seconds. However, in distant locations like Asia, where latency can reach 200ms, the website’s response times would soar to five seconds for backend processing and over 200ms for network transfer.
It’s crucial not to solely measure response times within your data center. LoadView offers a diverse range of load injection machines worldwide. Choose those that mirror the typical locations of your customers to ensure accurate testing and performance assessment.
Step 5: Run Your Test and Get Results
Start your configured test scenario. LoadView makes it easy and transparent—you only pay for what you use, and we’ll show you the estimated cost before you confirm. Throughout the load simulation, keep an eye on response time and throughput metrics via our user-friendly online dashboard. Once the test is done, we’ll send you a detailed summary report with a link to the full results.
If you encounter high error rates during the stress test, don’t worry. LoadView breaks down your website’s response times, helping your team quickly identify and address any issues. Dive into the waterfall chart to pinpoint performance bottlenecks or watch the video recordings for a visual look at your site under load.
After the test, easily access the detailed report right in your browser. And sharing results with your team? It’s a breeze—just send them the unique link we provide. No hassle, no fuss. Plus, LoadView keeps all your past test results handy for future reference. It’s perfect for benchmarking against new performance metrics after making changes to your application.

LoadView: Sample Scripts
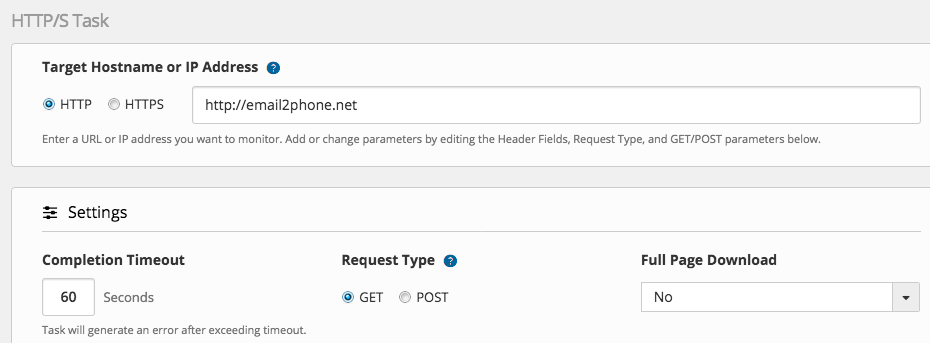
Protocol-Based (HTTP/S, GET/POST Requests)
- Choose HTTP or HTTPS
- Add URL to your landing page
- Set type GET or POST
- Set full page download option (yes/no)
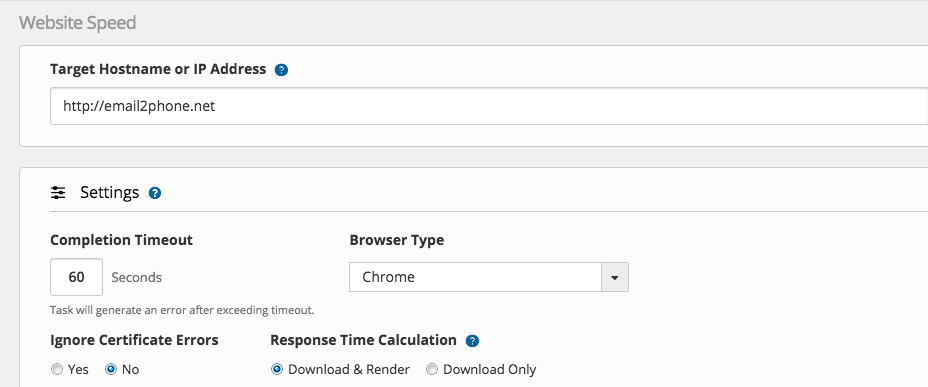
Headless (Single Page Browser Speed)
- Set URL to your landing page
- Set the timeout
- Select the browser
- Ignore certification errors (yes/no)
- Set the response time calculation option
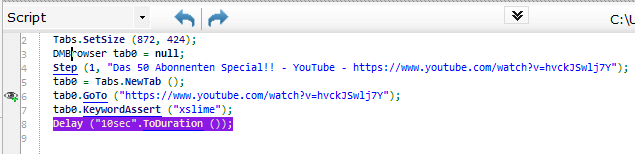
Real browser based (Scripted Multi-Step Browser)
- Start the Browser
- Loads a YouTube video
- Verifies the word “xslime”
- Waits 10 seconds
LoadView: Sample Test Report
Once your load test has finished, you will receive the test report, which provides an overview of the following performance metrics:
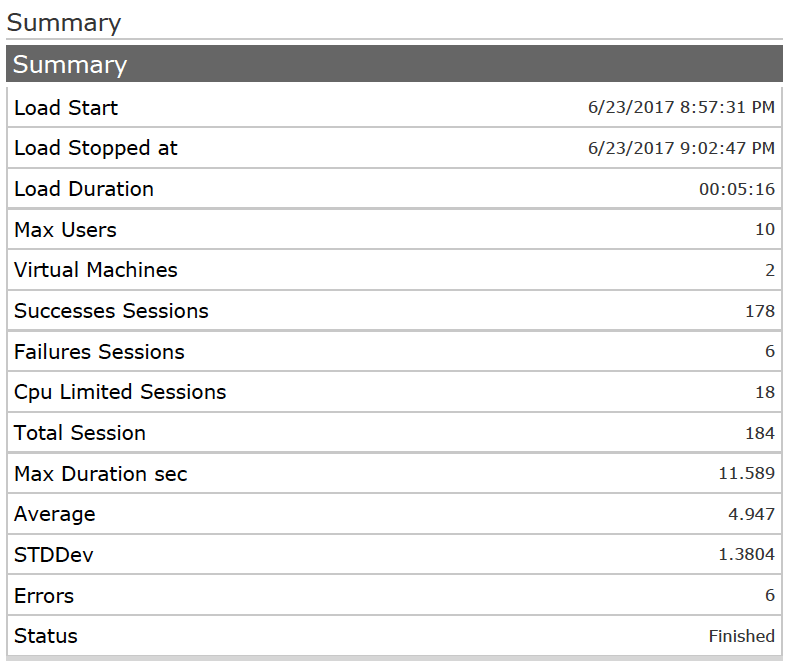
- Summary
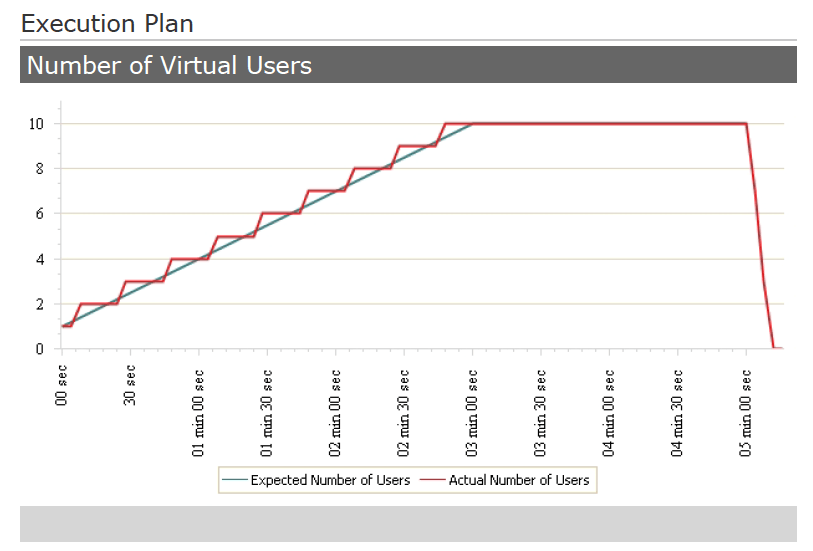
- Execution plan
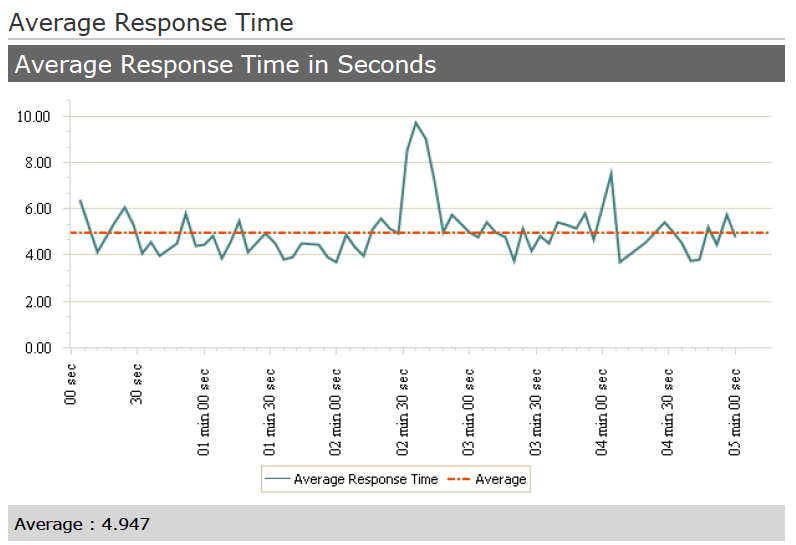
- Average and max response time
- Session overview
- Errors and error types
- Load on the load generator
The summary of this load test shows that we executed 178 sessions successfully, 6 sessions failed, and 4.9 seconds was the average response time.
The execution plan shows the ramp-up and ramp down of our simulated user. It ramped up to 10 users.
The average response time of this test was 4.9 seconds. There was a spike 2.5 minutes after the load test had started, with response times of above 8 seconds. Overall, the response times are stable around 5 seconds.
Why You Should Invest In Load Testing (And Choose LoadView)
Whether large or small, companies prioritize performance to meet user expectations. Our LoadView platform offers seamless and efficient performance testing tailored to these needs. Here’s why customers choose LoadView:
- Reusability: Maximize your investments by repurposing load testing devices for uptime monitoring or vice versa. This ensures optimal returns on your resources.
- Accurate User Simulation: Measure response time from various locations worldwide, reflecting real user experiences accurately.
- Ease of Use: Say goodbye to complex setups and on-premises load testing farms. With LoadView’s web-based platform, you can specify test settings and initiate load tests within minutes, hassle-free.
- Cost Efficiency: LoadView lets you prioritize essential tasks by charging only for the simulated load on your application. This ensures your investment is focused on what matters most.
- Expert Support: Our team of experts is readily available to address any questions or concerns, ensuring a smooth testing experience from start to finish.